Code
library(tidyverse)
# result <- read.csv(file = 'total_elements_mindat.csv')
df_72 <- read.csv(file = 'hardness.csv')
df_30 <- read.csv(file = 'hardness_30.csv')This dataset is generated based on the elements coexistence counts from Mindat.org database. The original data source is retrieved via Mindat API and stored in JSON format. Then after data pre-process and data cleaning steps, the retrieved data is cured and stored in CSV format. The dataset can be accessed at the Github repository, in the name of hardness.
The dataset was retrieved via Mindat API as a JSON file. In the data preprocessing step, the elements information are extracted in a new JSON file, in which some of the hierarchical structures have been removed in convenience of python’s to_csv function. Then the exported csv file can be read directly with R’s read.csv function.
I’m going to use the built-in read.csv package to import CSV file.
library(tidyverse)
# result <- read.csv(file = 'total_elements_mindat.csv')
df_72 <- read.csv(file = 'hardness.csv')
df_30 <- read.csv(file = 'hardness_30.csv')The glimpse command in the Tidyverse package is a nice way to summarize the data frame:
glimpse(df_72)Rows: 72
Columns: 7
$ X <int> 0, 1, 2, 3, 4, 5, 6, 7, 8, 9, 10, 11, 12, 13, 14, 15, 16,…
$ elements <chr> "H", "Li", "Be", "B", "C", "N", "O", "F", "Na", "Mg", "Al…
$ hmin <dbl> 0.5, 1.0, 1.0, 1.0, 1.0, 1.0, 0.5, 1.0, 0.5, 1.0, 0.5, 0.…
$ hmin_mineral <chr> "Rectorite", "Hectorite", "Beryllite", "Barberiite", "Ace…
$ hmax <dbl> 9.0, 8.0, 9.0, 10.0, 10.0, 10.0, 9.0, 8.0, 8.0, 9.0, 9.0,…
$ hmax_mineral <chr> "Bahianite", "Pezzottaite", "Bromellite", "Qingsongite", …
$ hmean <lgl> NA, NA, NA, NA, NA, NA, NA, NA, NA, NA, NA, NA, NA, NA, N…The dataset is stored as a great Flat Table, the items are 5883 mineral species from OpenMindat data server, and the columns representing the corresponding attributes.
c('elements', 'hmin', 'hmin_mineral', 'hmax', 'hmax_mineral', 'hmean')[1] "elements" "hmin" "hmin_mineral" "hmax" "hmax_mineral"
[6] "hmean" The attributes of the data are recorded in a 2-dimensional format, therefore the data frame rows will looks similar to the result of glimpse function. The ‘id’ field is in a strict ascending order, while not continuous. The ‘id’ field of each row is determined by the website managers or data providers, therefore it has nothing to do with some standard identifications. The ‘names’ field indicates the IMA approved mineral species names. The ‘elements’ and ‘sigelements’ fields indicating the elements of the mineral chemical formual, while the ‘sigelement’ is determined by some significant elements as a subset of ‘elements’. In compatable with csv format, the elements in this field are separated by hyphens \(-\).
head(df_72) X elements hmin hmin_mineral hmax hmax_mineral hmean
1 0 H 0.5 Rectorite 9 Bahianite NA
2 1 Li 1.0 Hectorite 8 Pezzottaite NA
3 2 Be 1.0 Beryllite 9 Bromellite NA
4 3 B 1.0 Barberiite 10 Qingsongite NA
5 4 C 1.0 Acetamide 10 Diamond NA
6 5 N 1.0 Acetamide 10 Qingsongite NAAmong all of the confusing hardness records in tens of elements, we want to sense the approximate hardness distribution via visualization.
library(ggplot2)
ggplot(df_72, aes(x=elements, y=hmax)) +
  geom_point(size=2, shape=23)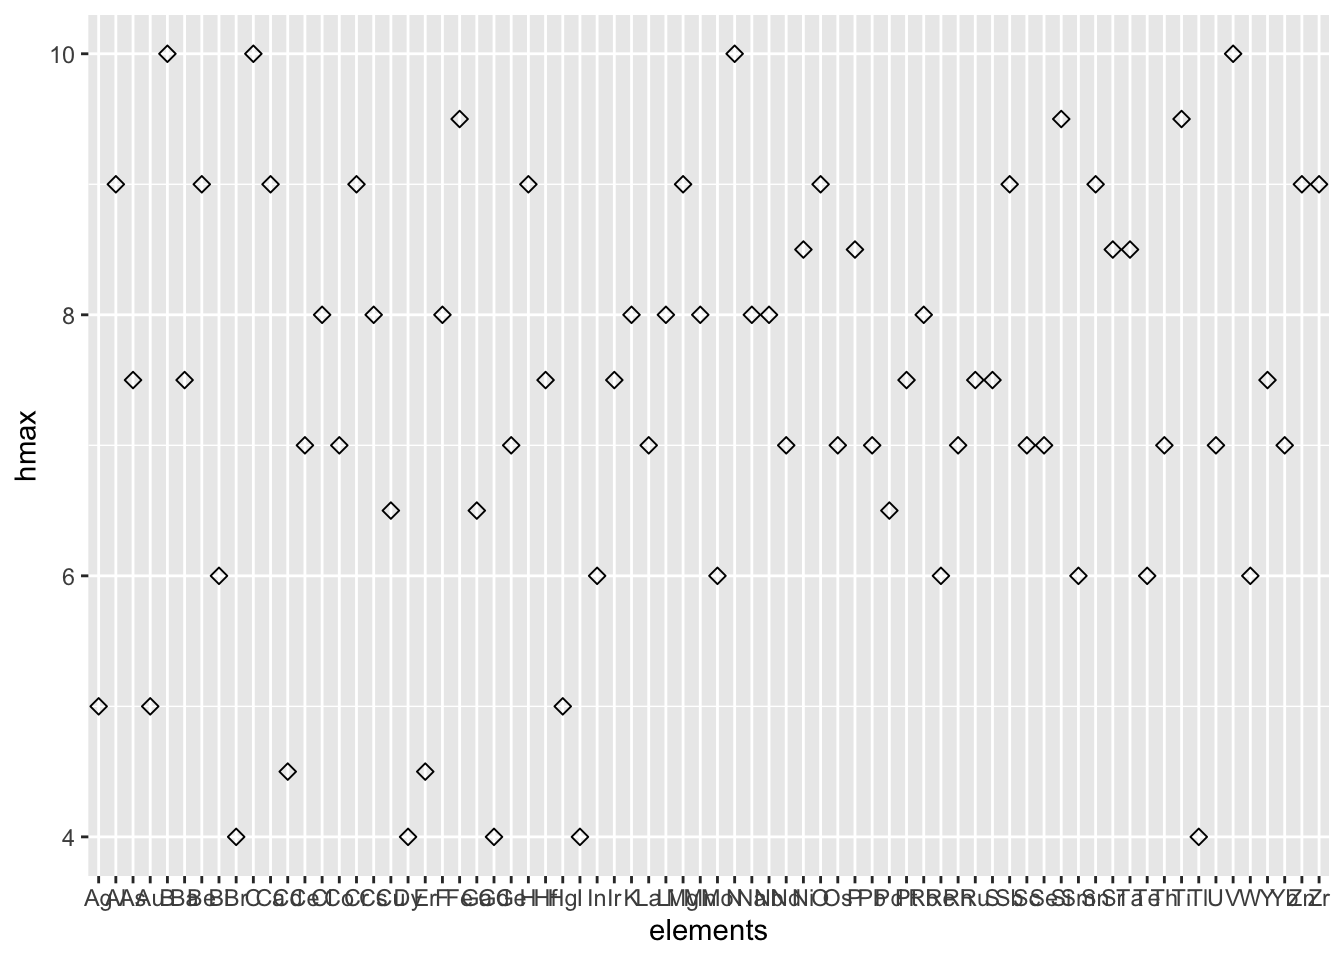
head(df_30) X elements hmin hmin_mineral hmax hmax_mineral hmean
1 0 H 0.5 Rectorite 9 Bahianite NA
2 1 B 1.0 Barberiite 10 Qingsongite NA
3 2 C 1.0 Acetamide 10 Diamond NA
4 3 O 0.5 Rectorite 9 Bahianite NA
5 4 F 1.0 Barberiite 8 Topaz NA
6 5 Na 0.5 Rectorite 8 Diaoyudaoite NAggplot(df_30, aes(x=elements, y=hmin)) +
geom_point(size=2, shape=23)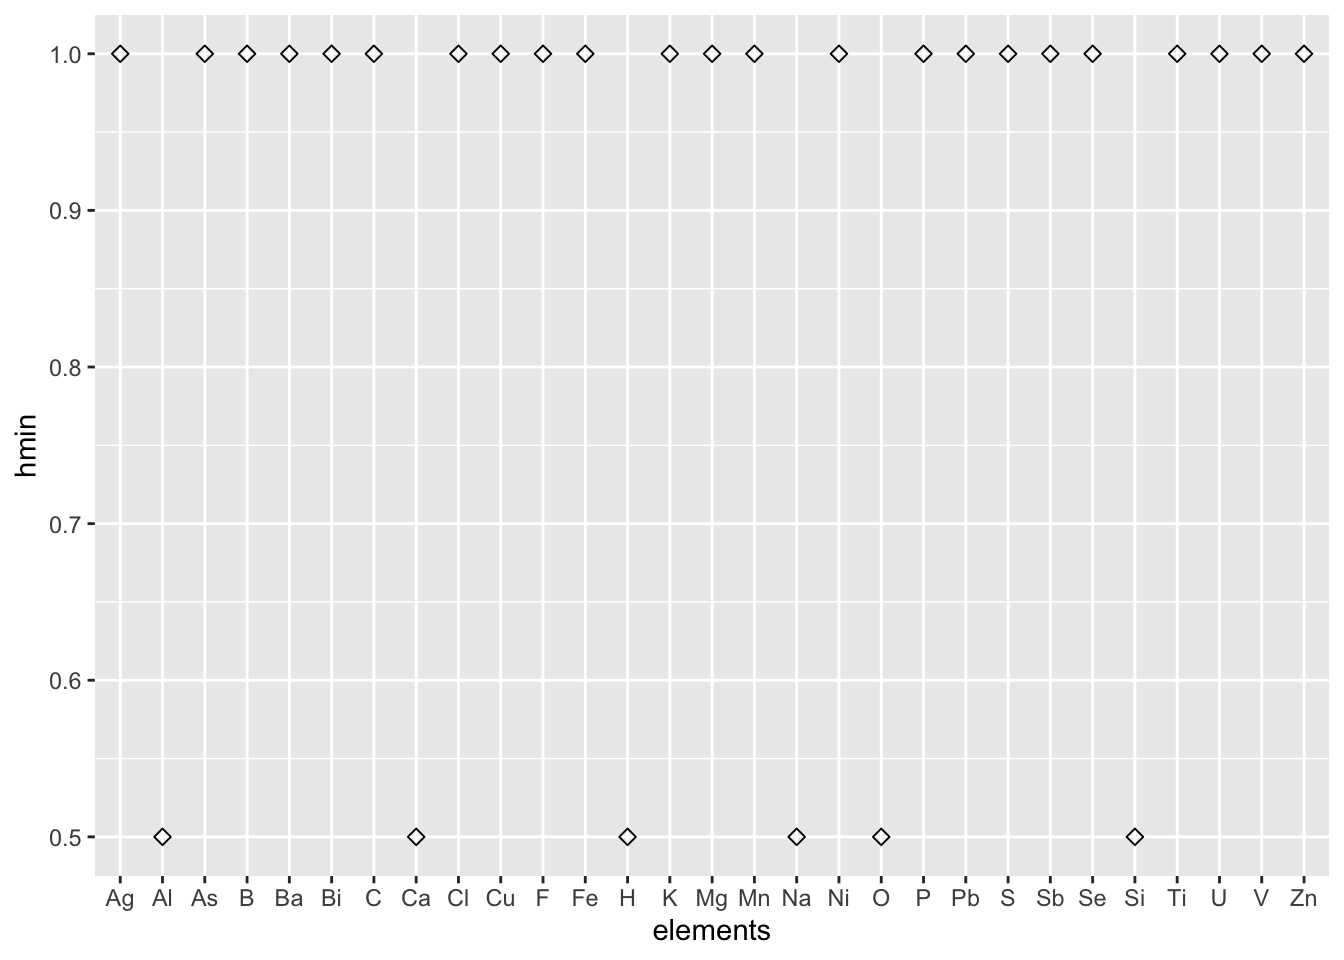
ggplot(df_30, aes(x=elements, y=hmax)) +
  geom_point(size=2, shape=23)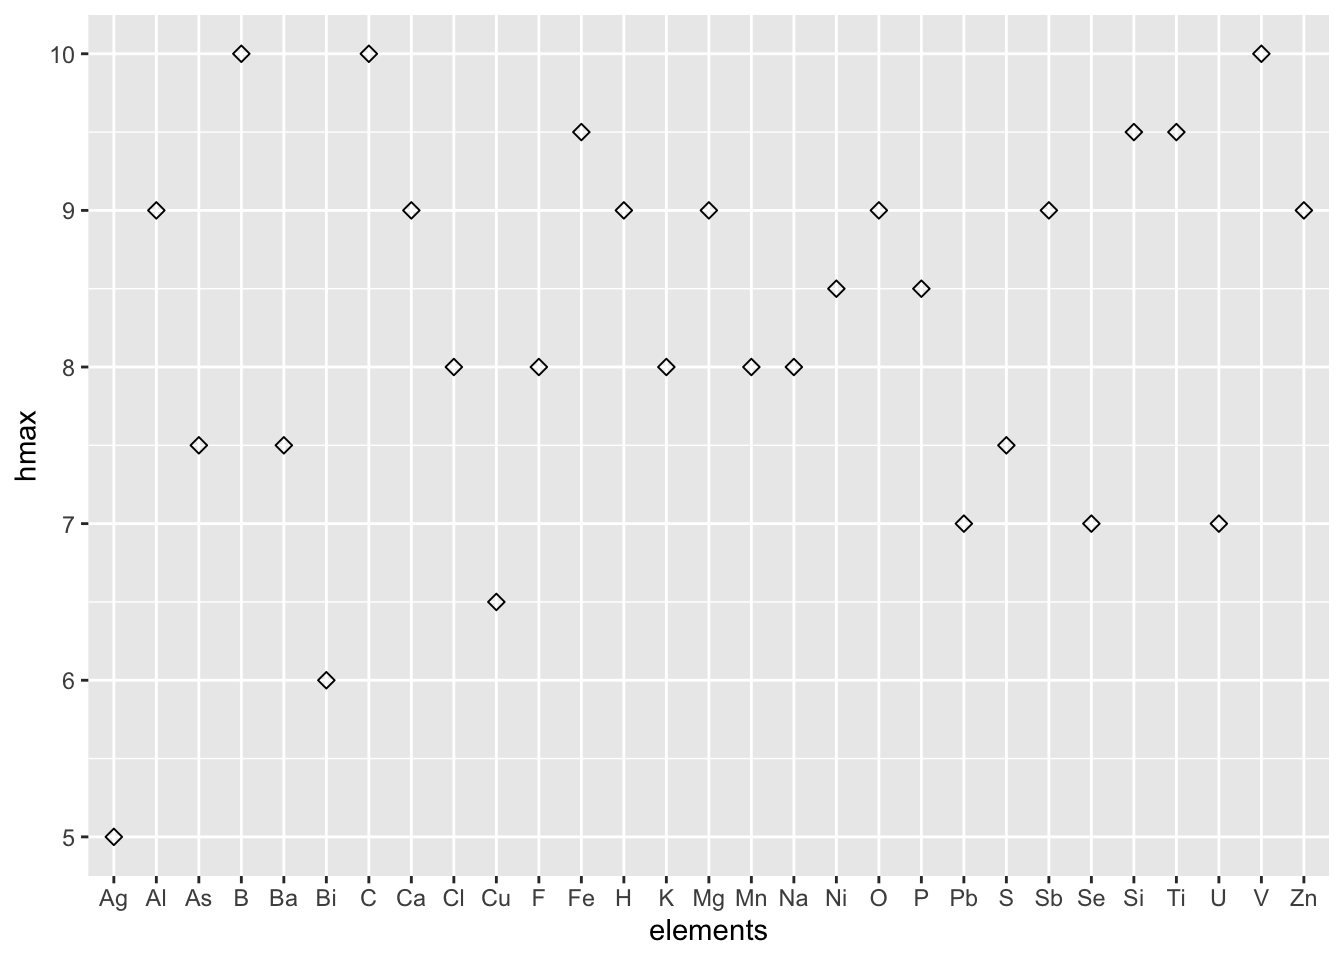
.qmd file failed to adapt to the html style.
The problem is that the .qmd file shall not consist of the hashtag # symbol.
Another issue fixed is that the json file is originally contains 5883 items, which should be converted into 5883 rows of csv items. While the converting results shows there were over 5900 rows. The reason for this problem is that there are some annoying \ns in the attributes, which will end up with new rows in the exported csv file. I fixed this issue by simply removing all the \ns in the json file.